

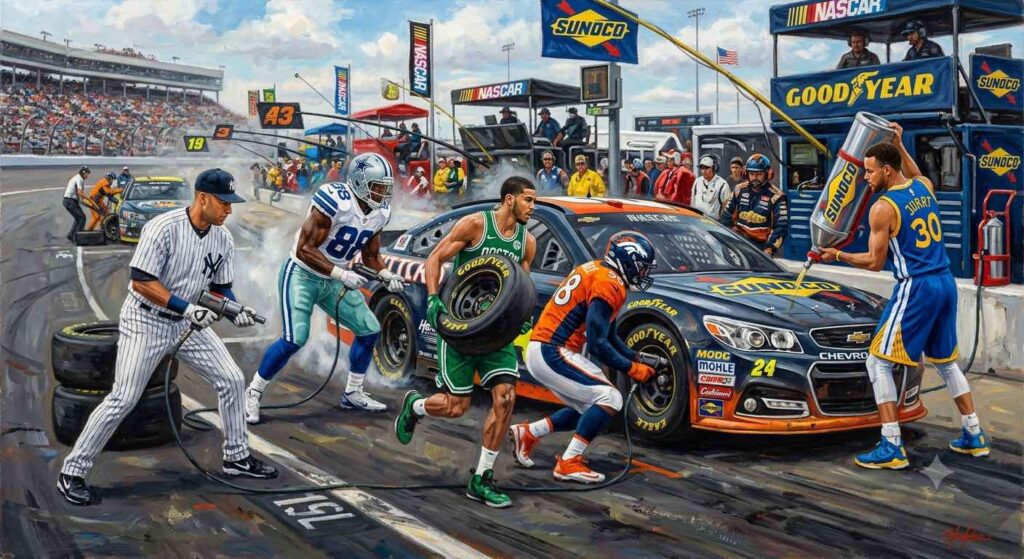
This post will cover maximizing efficiency of 1) Pit Crew 2) Lane Lines and 3) Driver Strategy.
Desired Outcome
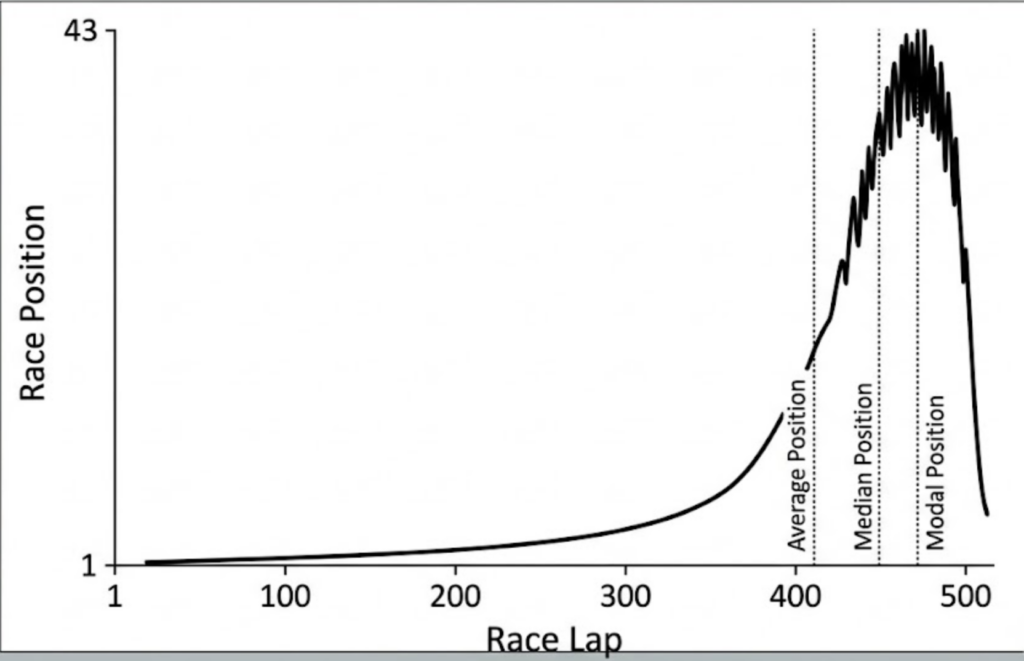
In the context of race position over time, a race winner’s position chart would typically be negatively skewed (left-skewed).
- The Curve Shape: If you plot a driver’s position on a graph where the x-axis represents the race progression (from lap 1 to the final lap) and the y-axis represents field position (with 1st place at the top):
- A winning driver spends the vast majority of the race near the front (1st, 2nd, or 3rd place). This creates a high, dense peak near the end/higher values of the time progression.
- Any time spent further back in the field—such as early in the race, during pit stop cycles, or while fighting up from a lower qualifying position—creates a long, sparse tail extending backward to the left toward the early laps.
Because the peak is concentrated at the right (later in the race) and the tail stretches out to the left (earlier in the race), the distribution is statistically negatively skewed. In summary, this is what winning the Daytona 500 looks like.
Pit Crew
I’ll categorize the pit crew’s time performance into three categories:
- 1st String: Time’s below the mean, 2-3 standard deviations.
- 2nd String: The mean or average, within 34.1% above and below the mean time.
- 3rd String: Time’s above the mean, 2-3 standard deviations.
In NASCAR, the duration of a pit stop during the Daytona 500 depends on the type of service performed:
- 4 Tires and Fuel (Standard Stop): 11 to 13 seconds. Top Cup Series pit crews average roughly 10.5 to 12 seconds.
- 2 Tires and Fuel: 8 to 10 seconds.
- Fuel Only (“Splash and Go”): 7 to 9 seconds.
For top-10 finishers at the Daytona 500, the average number of full, standard pit stops (4 tires + full fuel load) is 2 to 4 stops across the entire 200-lap (500-mile) distance.
Typical Daytona 500 Pit Strategy Breakdown
- Fuel Window Limit: Under green-flag conditions, a Next Gen NASCAR stock car can run approximately 40 to 45 laps on a single tank of fuel.
- Scheduled Full Stops: For a clean 200-lap race without major cautions, top-10 teams build a strategy around 3 to 4 scheduled full pit stops (spaced around Stage 1, Stage 2, and mid-Stage 3).
- Caution Off-Sequence Effect: Because cautions occur frequently at Daytona, teams often top off with quick fuel-only “splashes” or 2-tire stops under yellow flag conditions. As a result, top-10 finishers typically only perform 2 or 3 complete 4-tire standard stops over the course of the race, relying on partial stops or fuel-topping strategy for the rest.
Lane Lines
The main oval track at Daytona International Speedway does not have painted lane lines like a highway, but it is 40 feet wide, which allows cars to comfortably run 3 to 4 side-by-side racing lanes during the Daytona 500:
- Main Racing Surface: The track fits 3 distinct racing lanes comfortably (the bottom lane/inside line, middle lane, and top/outside wall lane), though drivers occasionally pack into 4-wide drafting lines.
- Apron: Below the main banking is a flat paved apron that provides additional space, though NASCAR rules forbid using the apron to pass (the double yellow line rule).
- Pit Road: Features 2 distinct operational lanes—an inner pit lane where teams service the cars in their pit stalls, and an outer acceleration/deceleration lane for driving past other pit stalls.
The total distance traveled during the Daytona 500 varies depending on which line a driver holds, because driving higher up on the banked track creates a larger circumference:
- 1) Bottom Lane / Inside Line: ~500.0 miles (2.500 miles per lap). This line follows the shortest geometric distance around the 2.5-mile track.
- 2) Middle Lane: ~502.8 miles (~2.514 miles per lap). Running in the middle adds roughly 70 feet to the radius of the turns, adding around 70–75 feet of distance per lap.
- 3) Top / Outside Wall Lane: ~505.5 miles (~2.528 miles per lap). Running against the outside wall adds roughly 140 feet of distance per lap compared to the bottom line, resulting in over 5 extra miles driven over a 200-lap race.
(Note: Although the top lane requires driving a longer physical distance, cars often run faster lap times (0.1 to 0.3 seconds per lap) there in high-speed drafting packs because the momentum and banking carry more speed through the turns).
The time it takes a NASCAR stock car to complete 2.8 miles and 5.5 miles depends on the type of track and average speed scenario:
1. Full-Speed Green-Flag Racing (Pure Lap Pace)
At continuous race speeds without cautions, cars typically average 180+ mph (superspeedways like Daytona or Talladega).
- At 180 mph Average Speed (Drafting / Superspeedway Pace):
- 2.8 miles: ~56 seconds (56.0 seconds)
- 5.5 miles: ~1 minute 50 seconds (110 seconds)
2. Full Race Average (Including Pit Stops & Caution Laps)
When accounting for yellow flags, safety pace cars, and pit stops, a typical NASCAR Cup Series race overall average speed drops to around 130 mph to 145 mph.
- At 130 mph Full-Race Average:
- 2.8 miles: ~1 minute 17 seconds (77.5 seconds)
- 5.5 miles: ~2 minutes 32 seconds (152.3 seconds)
Driver Strategy
For a driver to maximize time trimming, the following have to occur.
- Drive the Bottom Lane / Inside Line for the entire race.
- Draft the entire race.
- Limit 4-Tire Standard Stops to (2).
- Limit 2-Tire Changes (+ Gas) to (1)
- Limit Gas Only / “Splash & Go” Stops to (1).
Calculations
Pit Crew Calculations
(2) x 4 tire stop = +4 sec.
(1) x 2-Tire Changes = +2 sec.
(1) x Gas Only = +2 sec.
Max. Pit Crew Time Gained = +8 seconds
Lane Line Calculations
Condition 1: Drive the Bottom Lane / Inside Line for the entire race
Condition 2: 33 laps of caution laps averaged over last (3) Daytona 500 races
180 mph = +110 sec. X .868 = +95.48 sec.
130 mph = +152.3 sec. X .132 = +20.1036 sec.
Loss of speed due to driving bottom / inside = .2 sec. X 250 laps = -50 sec.
Max. Lane Line Time Gained = +65.5836 seconds
Driver Calculations
Max Drafting 5 sec. x 200 laps = +1000 seconds
Total Calculations
Max Drafting 5 sec. x 200 laps = +1000 seconds
Max. Pit Crew Time Gained = +8 seconds
Max. Lane Line Time Gained = +65.5836 seconds
Total Time Trimmed due to Max. Efficiency = 1,073.5836 = ~1,073 seconds or 17 minutes and 53 seconds of Total Trim Time